Loading...
← All work
Case study · The CapitalDelivered
Replacing gut-feel trading with decisions you can measure.
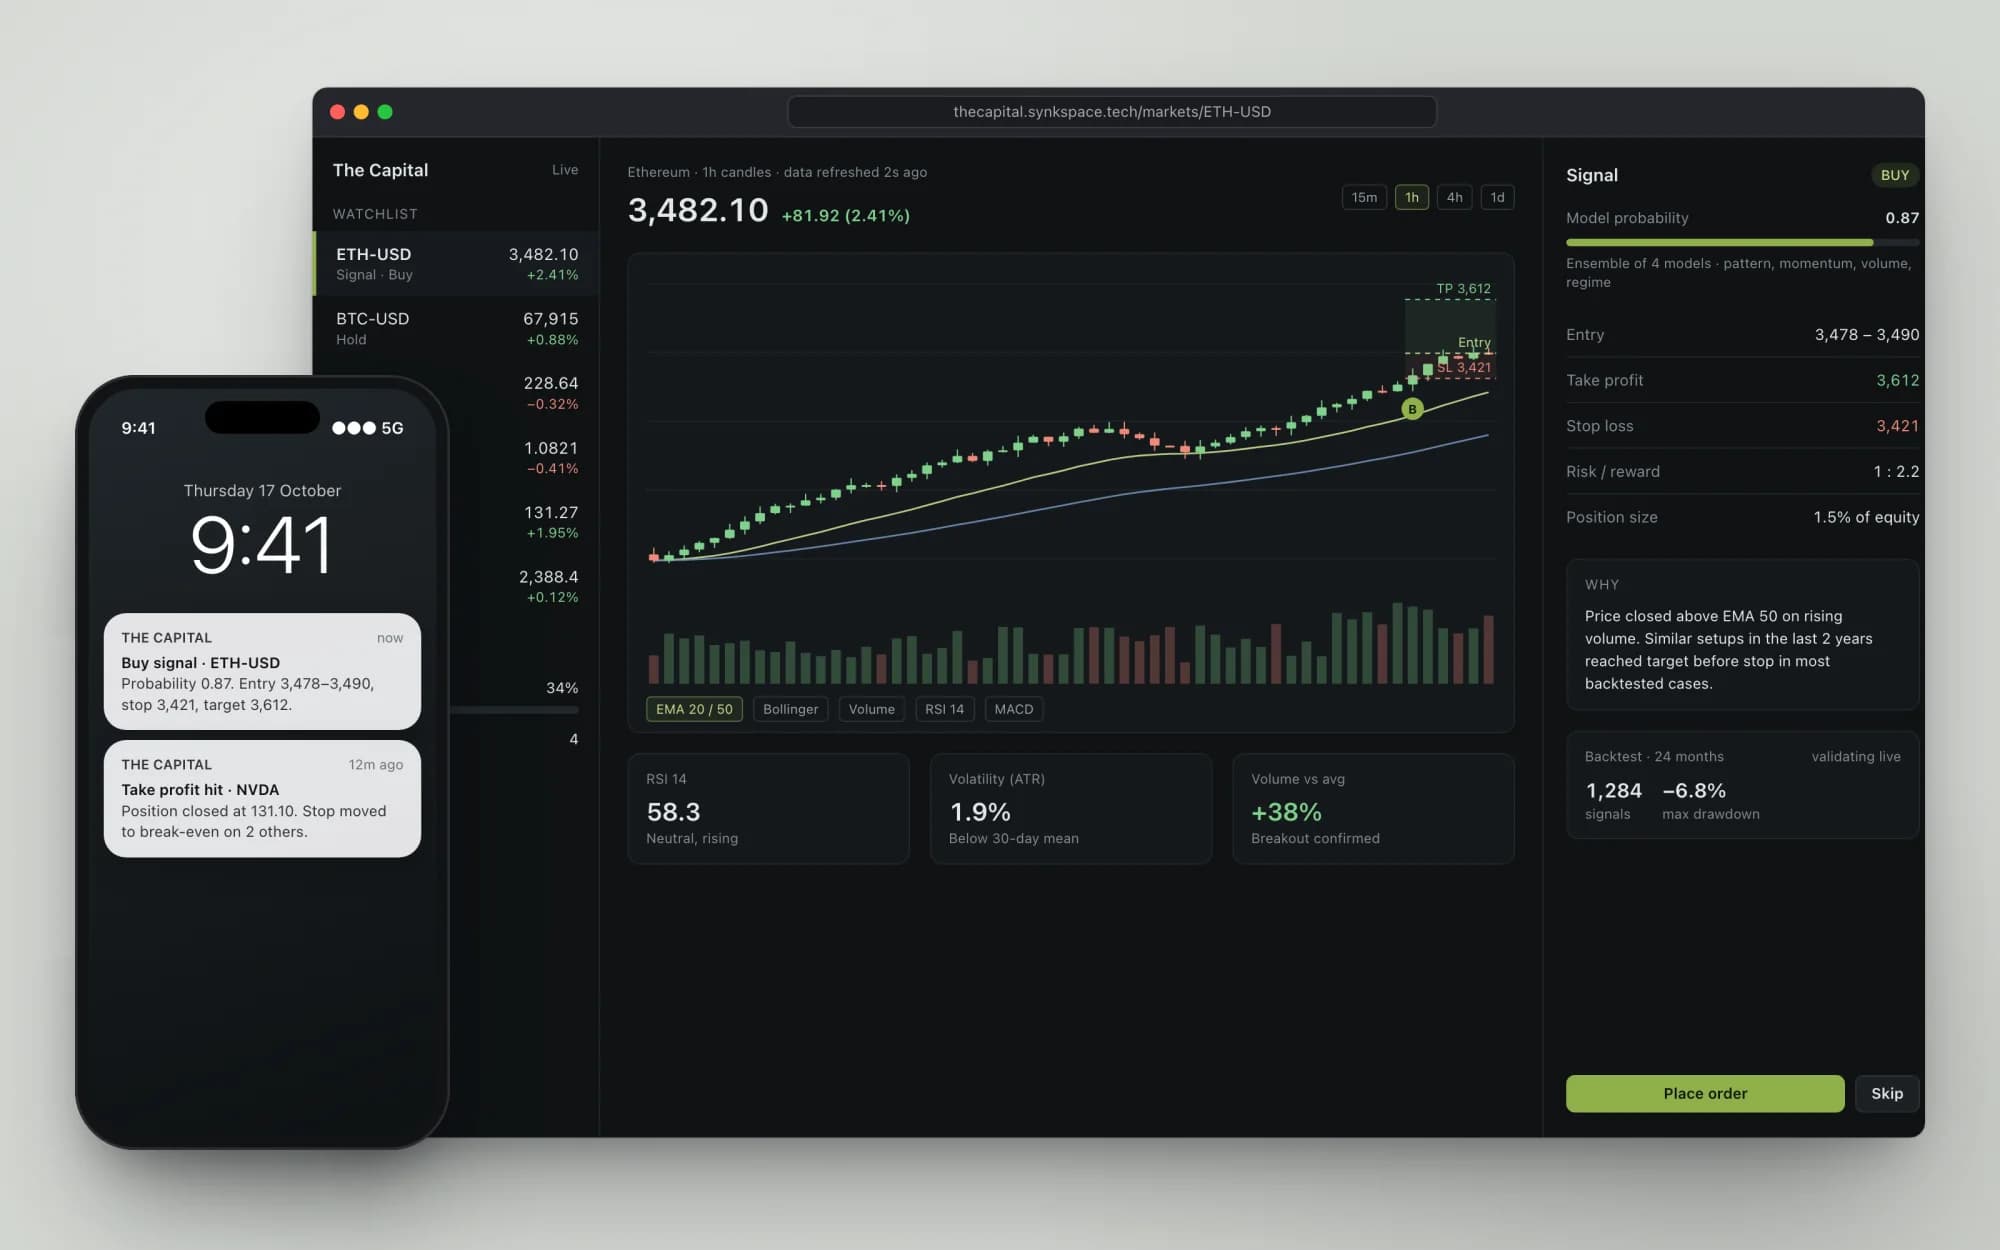
AI, statistics and machine learning read historical and live market data to forecast price moves. The platform turns each forecast into a signal with entry and exit points, then manages risk with automated stop-loss and take-profit orders.
- Sector
- Finance & Trading
- Our role
- Quantitative modelling, machine learning, data pipelines, platform build
- Capabilities
- AI & agents · Platforms · Automation
- Status
- Delivered
The challenge
Markets punish inconsistency, and instinct is never consistent.
Most trading decisions are made on instinct, and instinct is inconsistent. The Capital replaces emotional speculation with probability: every buy, sell or hold comes from a model that has weighed price patterns, volume, volatility and technical indicators.
What made it hard
- 01
Low signal-to-noise
Price, volume and volatility move at different frequencies across timeframes, and most of that movement is noise.
- 02
Probabilistic by nature
No model sees the future. Outputs have to be calibrated probabilities that a strategy can size positions against.
- 03
Risk as a first-class output
An entry without an exit is a gamble, so every signal must carry its own stop-loss and take-profit.
The approach
Every trade becomes a probability, with the exit planned before the entry.
Historical and live market data flow through a feature pipeline that computes price patterns and technical indicators across timeframes. Statistical and machine-learning models score the probability of the next move, and a signal engine converts that score into a buy, sell or hold with calculated entry, stop-loss and take-profit levels.
System map
- AI step
- Person in the loop
- Service or store
How it works
- 01
Ingest
Historical and real-time market data arrives: prices, trading volumes and volatility.
- 02
Read the market
Price patterns and technical indicators are computed across timeframes.
- 03
Predict
Mathematical and machine-learning models estimate the probability of the next move.
- 04
Signal
A forecast becomes a buy, sell or hold signal with calculated entry and exit points.
- 05
Manage risk
Stop-loss and take-profit levels are set automatically for every position.
Key decisions
The principles behind every signal.
Decision 01
Probability over prediction
Every signal carries a probability, so a trade is sized and judged on its odds, not on a yes or no.
Decision 02
Risk is automatic
Stop-loss and take-profit are part of the signal itself, so no position is opened without an exit plan.
Decision 03
Validated, not promised
Estimated prediction accuracy is 85 to 93 percent. That figure stays an estimate until it is independently validated through backtesting and live trading.
What shipped
A signal engine with risk management built in.
Market data ingestion
Historical and real-time price, volume and volatility in one pipeline.
Feature engineering
Price patterns and technical indicators computed across multiple timeframes.
Predictive models
Statistical and machine-learning models that output a probability, not a guess.
Signal engine
Buy, sell or hold, with calculated entry and exit points.
Automated risk controls
Stop-loss and take-profit attached to every position at creation.
Architecture
A cross-section of the system.
Every layer, from what people touch down to where it runs, and the one job each layer does.
L1Signals
Signal engine+Risk rules
Turns model probabilities into orders with entry, stop-loss and take-profit.
L2Intelligence
Machine learning+Statistical models
Estimates the probability of the next price move from engineered features.
L3Features
Technical indicators+Pattern detection
Multi-timeframe indicators and price patterns computed from raw market data.
L4Data
Real-time market data+Historical data
Streaming and historical price, volume and volatility feeds.
L5Runtime
Python
One language across research, backtesting and production signal generation.
Our scope
Quantitative research/Feature engineering/Machine learning/Data pipelines/Risk logic/Platform development
Client view
“Excellent work, A+++++. Will definitely hire again.”
Where it is now
Built, and being proven the right way.
The platform is built and generating signals. Its estimated 85 to 93 percent prediction accuracy is being independently validated through backtesting and live trading before it is treated as fact.
Something like this in mind?
Tell us the problem. We will tell you honestly if we are the right team to solve it.